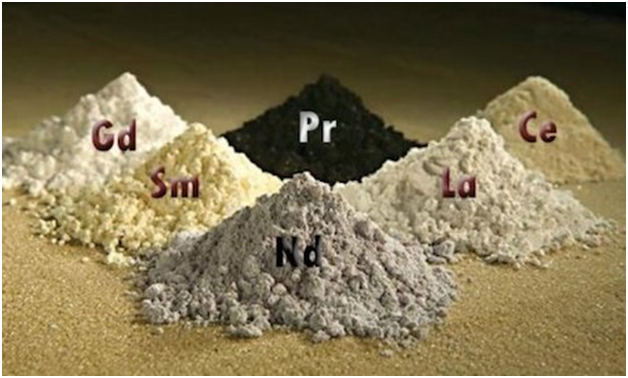
An introduction to Rare Earth Metals
There as 17 rare earth elements (REEs), 15 within the chemical group called lanthanides, plus yttrium and scandium. The lanthanides consist of the following: lanthanum, cerium, praseodymium, neodymium, promethium, samarium, europium, gadolinium, terbium, dysprosium, holmium, erbium, thulium, ytterbium, and lutetium. Rare earths are moderately abundant in the earth’s crust.Bastnasite, the world’s principal source of rare earths is produced in China and the United States.
Used in everyday electronic devices
REEsare used in many everyday electronic devices such as computer storage, DVDs, rechargeable batteries, cell phones, catalytic converters, magnets, fluorescent lighting and much more.Twenty years ago, there were only a few cell phones in use, however,that number has increased toseven billiontoday. Smartphones are the most prominent users of REEs with several varieties comprising 16 of the 17 elements. REEs are used in the display, phone circuitry and speakers.
Many rechargeable batteries are made with rare earth compounds. Demand for the batteries is being driven by demand for portable electronic devices like cell phones, readers, portable computers, and cameras.Rare earthis used as catalysts, phosphors, and polishing compounds. These elements are also used for pollution management, light up screens on electronic devices, and also forthe polishing of optical-quality glass.
|
Element |
Symbol | Atomic Number | Atomic Weight | Crustal Abundance (PPM) | Applications |
| Scandium | Sc | 21 | 44.96 | 22.00 | Strengthen aluminum alloys |
| Lanthanum | La | 57 | 138.91 | 39.00 | Glasses, ceramics, car catalysts, phosphors, pigments, accumulators |
| Cerium | Ce | 58 | 140.12 | 66.50 | Polishing powders, ceramics, phosphors, glasses, catalysts, pigments, UV filters |
| Praseodymium | Pr | 59 | 140.91 | 9.20 | Ceramics, glasses, pigments. |
| Neodymium | Nd | 60 | 144.24 | 41.50 | Permanent magnets, catalysts, pigments for glass, lasers |
| Promethium | Pm | 61 | 145.00 | NA | Sources for measuring devices, miniature nuclear batteries, phosphors |
| Samarium | Sm | 62 | 150.36 | 7.05 | Permanent magnets, microwave filters, the nuclear industry |
| Europium | Eu | 63 | 151.96 | 2.00 | Phosphors |
| Gadolinium | Gd | 64 | 157.25 | 6.20 | Visualization of images in medicine, optical and magnetic detection, ceramics, glasses, crystal scintillators |
| Yttrium | Y | 39 | 88.91 | 33.00 | Capacitors, phosphors, microwave filters, glasses, oxygen sensors, radars, lasers, superconductors |
| Terbium | Tb | 65 | 158.92 | 1.20 | Phosphors |
| Dysprosium | Dy | 66 | 162.50 | 5.20 | Phosphors, ceramics, nuclear industry |
| Holmium | Ho | 67 | 164.93 | 1.30 | Ceramics, lasers, nuclear industry |
| Erbium | Er | 68 | 167.26 | 3.50 | Ceramics, dyes for glass, optical fibers, lasers, the nuclear industry |
| Thulium | Tm | 69 | 168.93 | 0.52 | Electron bean tubes, visualization of images in medicine |
| Ytterbium | Yb | 70 | 173.04 | 3.20 | Metallurgy, chemical industry |
| Lutetium | Lu | 71 | 174.97 | 0.80 | Single crystal scintillators |
Notes: PPM – Parts per Million
China accounts for more than four fifths of the production
Around 133,000 metric tons of rare earth oxides (REOs) were produced worldwide in 2017. With the largest known rare earth reserves worldwide, it is not surprisingthat China alone produced nearly ~81.0% of total production. Canada, Greenland, and South Africa are expected to become important sources in the long term.
With the regulation of its export quotas, China effectively defines the global market and prices for rare earth elements. Over the last decade, Chinese raised export curbs due to the growing domestic demand. There was Rare Earths Trade Dispute in 2012 between China and several other countries, led by the US. China placed export restrictions on Tungsten and Molybdenum, one of the REEs used in electronics and China controls 97% of the supply. In 2014, the WTO ruled against China and the country dropped restrictions in 2015.
With the Chinese government managing rare earth supply, there are only a few large companies from other countries. Among the best known non-Chinese rare earth companies is Lynas Corporation from Australia. Prior to filing for bankruptcy in June 2015, the US-based Molycorp was a leading non-Chinese rare earth company. Other leading companies are Greenland Minerals & Energy, Iluka Resources, and Northern Minerals, all from Australia.

Price charts


Supply glut led to price crash in 2017, but outlook is positive
The demand for products where REEs are used is bound to grow multi-fold – whether it is the demand for batteries as EVs become more commonplace, smartphones, various typed of displays, wind turbines, etc. Unfortunately for REE producers, their overenthusiastic outlook for REE demand led to a considerably supply glut in 2017, which saw REE prices crashing. The supply glut was worsened by illegal production in China – gradually efforts to curb this are showing result and REEs prices have strengthened recently.
Given the dark clouds of the ongoing trade dispute and the uneven supply of REEs, dominated by China, the glut could very soon transform into a deficit in the next 2-3 years. According to David Merriman, deputy manager of Roskill Information Services, “Price increases are expected to be more gradual in 2018, reducing price shocks to consumers and maintaining good selling conditions for producers. Supply in China is expected to remain at a similar level, causing neodymium oxide to move further into supply deficit and become increasingly reliant upon stockpiled material.” And also stated that “the use of permanent magnet motors in new electric vehicle designs released in 2018 will be an interesting area to watch, as more and more models become reliant on permanent magnet designs.”
As for individual metals, neodymium will continue on in its place at or near the top of the rare-earths heap. Neodymium demand represented 14.0% of total global rare earths demand in 2017, and that amount is expected to increase to over 24.0% by 2027. Adamas Intelligence estimates that the value of global annual rare earth oxides for the production of rare earth permanent magnets totaled $1.44 bn in 2016. The firm sees demand for magnet-oriented rare earth oxides increasing to $6.07 bn by 2025, representing a CAGR of 17.4%.